
Transport Fever 3 Production Planner
Every recipe in the game is a ratio. Enter how much of a product you want and the planner multiplies the ratios down the whole chain: how much of every intermediate good, how many production runs each factory makes, which raw materials you need to haul in, and what is left over as a by-product.
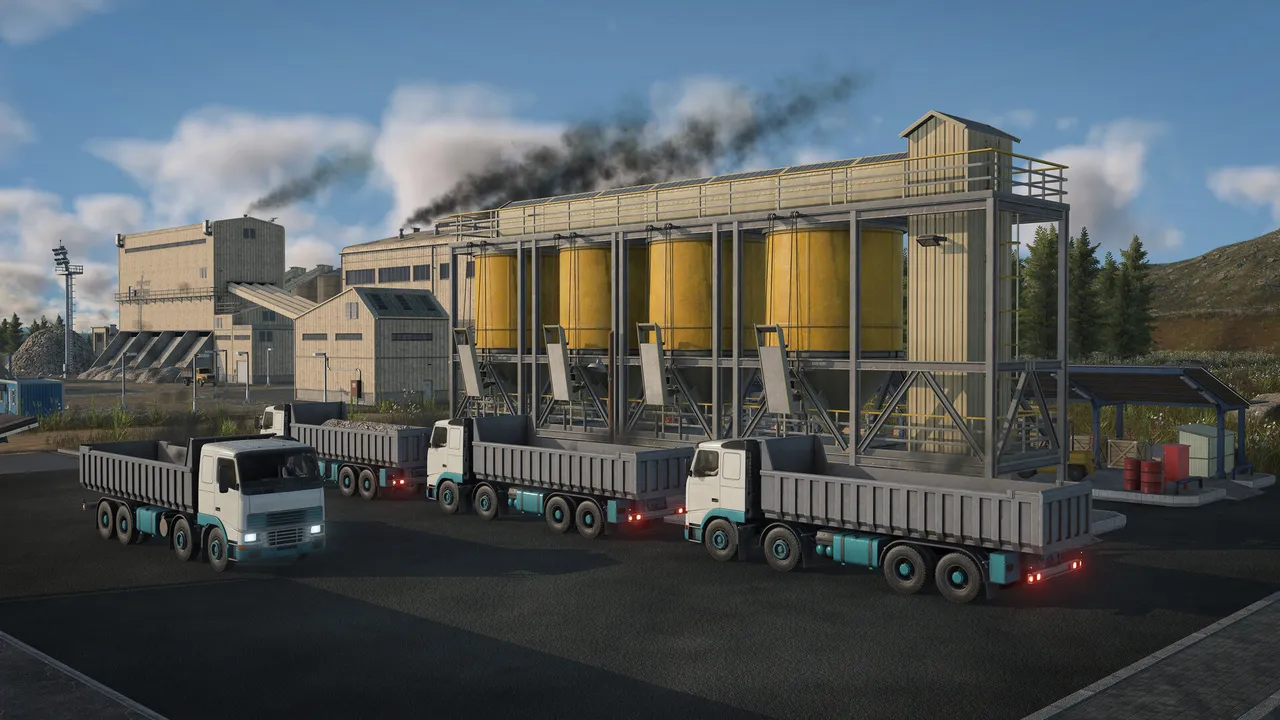
made by the Vehicle Factory
Raw materials to haul in
- Iron Ore600
- Coal600
- Rubber200
- Crude Oil68.6
Left over as by-products
- Dyes+22.9
- Steel+200
- Fuel+34.3
- Fertilizer+17.1
Sell these to a town that asks for them, or feed another chain.
Every factory in the chain
| Industry | Production runs | Takes in | Puts out |
|---|---|---|---|
| Vehicle Factory | 100 | 100 Tires + 400 Sheet Metal + 100 Machines | 100 Vehicles |
| Machine Factory | 14.3 | 100 Steel + 57.1 Plastic | 100 Machines |
| Chemical Plant | 11.4 | 68.6 Chemicals | 22.9 Dyes + 57.1 Plastic |
| Tire Factory | 50 | 200 Rubber | 100 Tires |
| Steel Mill | 100 | 600 Iron Ore + 600 Coal | 400 Sheet Metal + 300 Steel |
| Oil Refinery | 17.1 | 68.6 Crude Oil | 34.3 Fuel + 17.1 Fertilizer + 68.6 Chemicals |
A production run is one turn of the industry's recipe. How many runs a single industry manages in a year depends on supply, workers and boosters, so compare these ratios with the yearly figures in each industry's window in your save.
A worked example: 100 Vehicles
The Vehicle Factory turns 1 Tires, 4 Sheet Metal and 1 Machines into 1 Vehicles, so 100 Vehicles means 100 production runs. Behind it, the chain needs 200 Rubber, 600 Iron Ore, 600 Coal, 68.6 Crude Oil.
The Steel Mill is the interesting step. Each run makes 4 Sheet Metal and 3 Steel together, and the Vehicle Factory wants far more Sheet Metal than the Machine Factory wants Steel. Running it 100 times to cover the Sheet Metal leaves 200 Steel spare, which is why a vehicle chain pairs so well with a second customer for Steel. The chain finder shows who else takes it.
What the numbers mean in your save
The planner works in ratios, not per-year totals. A single industry's real output depends on how well it is supplied, whether workers reach it and whether a booster is running, and each industry window shows its production over the last 365 days next to its theoretical maximum. Use the planner to see the proportions, then read those windows to see which link is short.
From ratios to vehicles
Once you know how many Sheet Metal or Coal a year a chain needs, the line planner turns that into how many trains or trucks the route needs. For every recipe side by side, see the industries and cargo list.